%20--%3e%3cg%3e%3cg%20id='Layer_1'%3e%3cg%3e%3cg%3e%3cg%3e%3cg%3e%3cpath%20class='cls-1'%20d='M54.7,12.3c-1.4-1-3.3-1.6-5.5-1.6s-4.1.5-5.5,1.6c-1.7,1.2-2.5,2.9-2.5,5v11.8h5v-11.8c0-.4.1-.7.5-.9.6-.4,1.4-.6,2.6-.6s2,.2,2.6.6c.3.2.4.5.4.9v9.8c0,.5.2,1,.6,1.4.4.4.8.6,1.4.6h3v-11.8c0-2.1-.8-3.7-2.5-5Z'/%3e%3cpath%20class='cls-1'%20d='M75.4,11.1c-1,0-1.9.4-2.5,1.1-1.5-1.1-3.4-1.6-5.5-1.5s-4.4,1.1-6,2.7-2.7,4-2.7,6.5,1,4.9,2.7,6.7,4,2.7,6.6,2.7,3.4-.5,4.8-1.5c.6.7,1.4,1.1,2.5,1.1h1.7V11.1h-1.7ZM71.2,23.2c-.9.9-1.9,1.3-3.2,1.3s-2.3-.5-3.1-1.3-1.2-1.8-1.2-3,.4-2.3,1.2-3.1,1.9-1.3,3.1-1.3,2.2.4,3.1,1.3c.9.9,1.3,1.9,1.3,3.1s-.4,2.2-1.3,3.1h0Z'/%3e%3cpath%20class='cls-1'%20d='M89.5,10.7c-1.5,0-2.8.3-4,1v-6.8h-5v24.1h1.7c1,0,1.9-.4,2.5-1.1,1.5,1.1,3.2,1.6,5.2,1.5s4.7-1.1,6.3-2.8,2.7-4,2.7-6.5-.9-4.8-2.7-6.6c-1.8-1.8-4-2.7-6.6-2.7ZM92.6,23.2c-.9.9-1.9,1.3-3.1,1.3s-2.3-.5-3.1-1.3-1.3-1.9-1.3-3.1.5-2.3,1.3-3.1,1.9-1.3,3.1-1.3,2.3.5,3.1,1.3,1.3,1.9,1.3,3.1-.5,2.3-1.3,3.1Z'/%3e%3cpath%20class='cls-1'%20d='M116.3,11.1c-1,0-1.9.4-2.5,1.1-1.5-1.1-3.4-1.6-5.5-1.5s-4.4,1.1-6,2.7-2.7,4-2.7,6.5,1,4.9,2.7,6.7,4,2.7,6.6,2.7,3.4-.5,4.8-1.5c.6.7,1.4,1.1,2.5,1.1h1.7V11.1h-1.7ZM112.1,23.2c-.9.9-1.9,1.3-3.2,1.3s-2.3-.5-3.1-1.3-1.2-1.8-1.2-3,.4-2.3,1.2-3.1,1.9-1.3,3.1-1.3,2.2.4,3.1,1.3c.9.9,1.3,1.9,1.3,3.1s-.4,2.2-1.3,3.1h0Z'/%3e%3cpath%20class='cls-1'%20d='M157.2,11.1c-1,0-1.9.4-2.5,1.1-1.5-1.1-3.4-1.6-5.5-1.5s-4.4,1.1-6,2.7c-1.8,1.8-2.7,4-2.7,6.5s1,4.9,2.7,6.7,4,2.7,6.6,2.7,3.4-.5,4.8-1.5c.6.7,1.4,1.1,2.5,1.1h1.7V11.1h-1.7ZM153,23.2c-.9.9-1.9,1.3-3.2,1.3s-2.3-.5-3.1-1.3-1.2-1.8-1.2-3,.4-2.3,1.2-3.1,1.9-1.3,3.1-1.3,2.2.4,3.1,1.3c.9.9,1.3,1.9,1.3,3.1s-.4,2.2-1.3,3.1h0Z'/%3e%3cpath%20class='cls-1'%20d='M164.6,10.6c.8,0,1.5-.3,2.1-.9.6-.6.9-1.3.9-2.1s-.3-1.5-.9-2.1c-.6-.6-1.3-.9-2.1-.9s-1.5.3-2.1.9c-.6.6-.9,1.3-.9,2.1s.3,1.5.9,2.1c.6.6,1.3.9,2.1.9Z'/%3e%3c/g%3e%3cpath%20class='cls-1'%20d='M130.2,24c0,0-.2,0-.2.1-.3.2-1.8.3-2.3.3s-1.1-.1-1.4-.4c-.2-.2-.3-.6-.3-1.2v-6.8h2.4c.5,0,1-.2,1.4-.6.4-.4.6-.8.6-1.4v-3h-4.3v-1.6c0-.5-.1-1-.4-1.4-.7-1.1-1.7-1.6-2.8-1.6h-1.7v16.4c0,1.9.6,3.5,1.9,4.7,1.2,1.2,2.8,1.8,4.8,1.8s1.8,0,2.6-.2v-5.3Z'/%3e%3c/g%3e%3crect%20class='cls-1'%20x='162'%20y='11.6'%20width='5'%20height='17.6'/%3e%3cpath%20class='cls-1'%20d='M139.6,26.1c0,1.8-1.5,3.3-3.3,3.3s-2.6-.2-2.8-.2c0,0-.5-2.2-.5-3.1,0-1.8,1.5-3.3,3.3-3.3s2.8.1,3,.4c.2.4.4,2,.4,3Z'/%3e%3c/g%3e%3cpath%20class='cls-1'%20d='M29.3,17.5c-1.9,0-3.5,1.3-3.9,3h-.3c-2.8,0-5.3,1.2-7,3.1v-4.9c0-3.3.5-4.5,3.2-4.6.5,1.6,2,2.7,3.8,2.7s4-1.8,4-4-1.8-4-4-4-3.3,1.2-3.8,2.9c-1.3,0-2.3.3-3.1.7v-4.6c1.6-.5,2.7-2,2.7-3.8S19,.2,16.8.2s-4,1.8-4,4,1.2,3.3,2.9,3.8v4.6c-.8-.5-1.9-.7-3.3-.8-.5-1.7-2-2.9-3.8-2.9s-4,1.8-4,4,1.8,4,4,4,3.2-1.1,3.8-2.7c0,0,0,0,0,0,2.8,0,3.3,1.1,3.3,4.6v4.9c-1.7-1.9-4.2-3.1-7-3.1h-.7c-.4-1.7-2-3-3.9-3S0,19.3,0,21.5s1.8,4,4,4,3.1-1,3.7-2.5h.9c3.9,0,7,3.1,7,7v1.6h-4.2c-.7,0-1.2.5-1.2,1.2s.5,1.2,1.2,1.2h10.9c.7,0,1.2-.5,1.2-1.2s-.5-1.2-1.2-1.2h-4.2v-1.6c0-3.9,3.2-7,7-7h.5c.6,1.5,2,2.5,3.7,2.5s4-1.8,4-4-1.8-4-4-4ZM25,11.4c.9,0,1.6.7,1.6,1.6s-.7,1.6-1.6,1.6-1.6-.7-1.6-1.6.7-1.6,1.6-1.6ZM8.6,14.5c-.9,0-1.6-.7-1.6-1.6s.7-1.6,1.6-1.6,1.6.7,1.6,1.6-.7,1.6-1.6,1.6ZM4.1,23.1c-.9,0-1.6-.7-1.6-1.6s.7-1.6,1.6-1.6,1.6.7,1.6,1.6-.7,1.6-1.6,1.6ZM16.8,5.7c-.9,0-1.6-.7-1.6-1.6s.7-1.6,1.6-1.6,1.6.7,1.6,1.6-.7,1.6-1.6,1.6ZM29.3,23.1s0,0,0,0c0,0,0,0,0,0,0,0-.1,0-.2,0,0,0,0,0,0,0-.8-.1-1.3-.8-1.3-1.5s.6-1.5,1.4-1.6c0,0,0,0,0,0,0,0,0,0,0,0s0,0,0,0c0,0,0,0,0,0,.9,0,1.6.7,1.6,1.6s-.7,1.6-1.6,1.6Z'/%3e%3c/g%3e%3c/g%3e%3c/g%3e%3c/svg%3e)

When we talk about mangrove restoration or conservation, one of the first questions we ask is deceptively simple: Where are the mangroves?
At first glance, the answer seems obvious. You can see clusters of green along the coastline, rooted in tidal zones. But defining their exact extent - and understanding how that changes over time - is far more complex than it appears.
Ecosystems don’t exist in neat boundaries.
Mangroves blend into saltmarsh. Saltmarsh transitions into bare ground or salt flats. Water levels shift, sediments move; vegetation grows, dies back, and regenerates. What looks like a clear line on a map is, in reality, a dynamic edge that is constantly evolving.
And that’s where measurement becomes both challenging and essential.
A quick note before we dive in - Nabat’s Land cover classification isn’t built for mangroves alone. It maps coastal and dryland environments alike, distinguishing vegetation, soil, water, and transitional habitat types across very different landscapes. For this piece, we’re focusing on what that capability means for mangroves specifically.
Beyond “Mangrove vs Non-Mangrove”
At Nabat, mapping mangrove extent isn’t just about drawing a boundary - it’s about understanding what actually exists on the ground, and how those conditions are changing. This work runs on NabatOS, Nabat’s end-to-end platform for mapping, assessing, planning, restoring, and monitoring ecosystems.
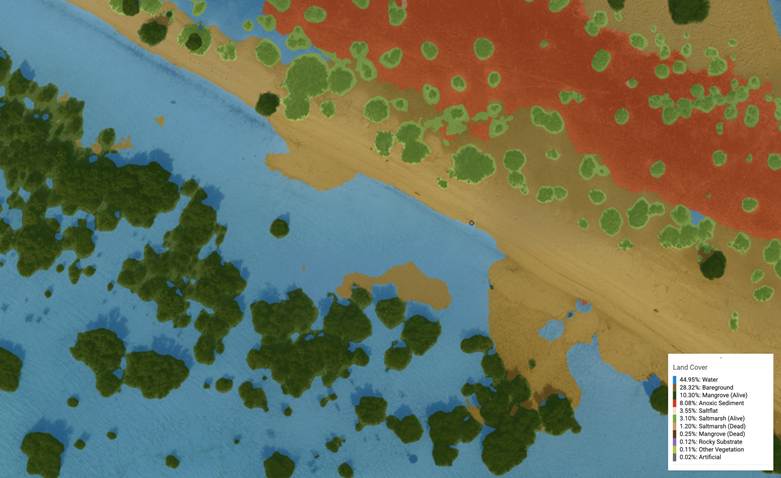
To do this, we move beyond a simple binary view of the landscape and instead classify it into a much richer set of categories: living mangroves, dead mangroves, healthy saltmarsh, degraded saltmarsh, bare ground, salt flats, open water, artificial surfaces, and more specific substrates like anoxic sediment or rocky substrate.
Each of these tells a broader story.
An expanse of healthy mangrove canopy might suggest a stable system. But each class carries its own ecological signal, pointing to underlying processes within the system. Anoxic sediment, for instance - dark, oxygen-depleted ground exposed at low tide - often indicates a history of waterlogging or drainage disruption and can signal whether an area is on a trajectory toward recovery or further decline. Expanding salt flats suggest hypersaline conditions that few species tolerate. The skeletal outlines of dieback point toward recent stress events: disease, salinity spikes, or hydrological change.
When you look at these layers together, the “extent” of a mangrove system stops being a single line on a map and becomes something far more meaningful - a landscape in motion. Nearby pockets of dieback, encroaching salt flats, or exposed bare ground don’t just modify the boundary; they begin to explain why that boundary exists where it does.
The Case for RGB: Simplicity as Strength
Technically, this classification is achieved through Nabat’s Land Cover Classification model - and one of its less obvious but more consequential design choices is its primary reliance on high-resolution RGB (red, green, blue) imagery rather than multispectral data.
Multispectral sensors offer rich spectral information across wavelengths invisible to the human eye, and they have long been the default for this kind of work. But they introduce complexity: specialist hardware, calibration requirements, and constraints on which datasets and platforms the model can run against.
By training the model on RGB data instead, we pushed it to interpret the landscape through visual and structural cues - differences in color, texture, canopy density, and spatial pattern. Dense green mangrove canopy, the pale surface of salt flats, the dark tones of water and anoxic sediment, the fractured geometry of dieback - all these carry distinct signatures that a well-trained model can learn to read reliably.
The practical payoff is significant. A model built on RGB data can be applied across a far wider range of datasets and geographies, without dependency on specialist sensors. And critically, it can be extended to high-resolution satellite imagery - which means that in situations where drone access is limited due to logistics, permitting, or the sheer scale of an area, satellite data allows monitoring and classification to continue with consistency.
Where the Model Is Uncertain Is Where It Matters Most
As with all classification work, the model is only part of the story.
A significant part of our workflow focuses on identifying where the model is uncertain - where it confuses one class for another or struggles at the transitional edges where ecosystems overlap. These zones of ambiguity are often ecologically the most interesting. They mark the places where mangrove gives way to saltmarsh, where saltmarsh shades into bare ground, where active dieback borders healthy canopy.
Rather than treating uncertainty as noise to be suppressed, we return to these areas - correcting labels, refining classifications, and iterating the data. Over time, this makes the model not just more accurate, but more representative of how these systems actually behave.
The edge cases, handled honestly, become the most instructive data points.
From Classification to Suitability
Once the landscape is mapped at this level of detail, a new set of questions becomes possible.
Where could mangroves exist, but don’t yet?
Where are conditions already suitable for restoration?
And where have interventions actually led to meaningful change?
By analyzing surrounding land cover - saltmarsh presence and condition, sediment type, hydrological connectivity, and tidal inundation - we can begin to identify where mangroves could exist but are currently absent. From there, Nabat’s site suitability scoring highlights areas with the highest likelihood of long-term establishment and survival.
This changes how restoration is approached. Rather than selecting sites reactively, it becomes possible to prioritize areas with stronger ecological foundations and a higher chance of long-term success.
The Record That Accumulates Over Time
The same data that supports suitability assessment also, when collected consistently, becomes a record.
A record that shows how landscapes respond to intervention - where seeding efforts have successfully established, where growth has stabilized into functioning canopy, and where, despite intervention, conditions may not have supported long-term survival.
Shall we put a before and after image? Restoration rarely looks dramatic from one season to the next. Change accumulates gradually - small areas of new growth becoming established canopy, previously degraded areas transitioning into functional habitat, or outcomes falling short of expectations in ways that are only visible in retrospect.
Each of these carries insight. And over time, those insights compound - informing better site selection, improving intervention strategies, and building a more grounded understanding of what ecological success looks like on the ground.
This longitudinal view is also what makes digital monitoring, reporting, and verification (MRV) meaningful rather than just procedural. Continuous, spatially comprehensive, validated against consistent baselines - it is the difference between a snapshot and a story. For the investors, regulators, and government agencies that Nabat works with, that distinction matters enormously.
Reading the Signals in the Gulf
In regions like the Gulf, this level of understanding becomes particularly critical.
Mangrove ecosystems here exist under a unique combination of pressures: extreme temperatures, high salinity, rapid coastal development, and broader regional uncertainty. Change is often gradual, but it is constant. And in this context, defining extent is not just about drawing boundaries - it is about reading signals.
Is an area of expansion stable, or temporary?
Is dieback isolated, or spreading?
Are surrounding habitats supporting growth, or actively limiting it?
These are the kinds of questions that only become visible when you look beyond a single boundary and begin to understand the system as a whole.
What this work has reinforced is that ecosystems rarely fit neatly into categories - but that doesn’t mean we shouldn’t try to understand them systematically. If anything, it makes that effort more important.
Because the better we can represent complexity, the better we can respond to it. The more clearly, we can track change over time, the more confidently we can say - not just where ecosystems are, but how they are evolving, and what role we are playing in that process.
In the Gulf, where half of mangrove ecosystems face significant risk by mid-century and where the pace of coastal change is among the fastest on Earth, that clarity is not a technical nicety - it is the foundation on which any serious restoration effort must be built.
Producing that clarity and carrying it through from first assessment to verified outcome, is what NabatOS is built to do. If you are shaping a mangrove restoration program in the Gulf or beyond and need extent mapping you can stand behind, we would welcome the conversation.
Biography:

My work focuses on bridging ecology and technology to support landscape restoration at scale. At Nabat, I help develop the ecological data systems, standards, and annotation frameworks that underpin our AI and machine learning models. By working closely with ecologists, engineers, and product teams, I translate complex ecological knowledge into practical, data-driven solutions for monitoring and restoring ecosystems. I am passionate about leveraging technology to deliver meaningful environmental outcomes and accelerate ecosystem recovery.